NFL Team Salary Scraping - Part 1
Background and problem statement
I first started thinking about this problem over the 2015-2106 NFL offseason. During that time one of the biggest stories was the holdout and potential free agency of then Quarterback Ryan Fitzpatrack. Over the course of the 2015 season Fitzpatrick helped the Jets win 10 games and had career year where he enjoyed personal bests, with nearly 4,000 yards passing and 31 TD passes (a franchise record). However, the Jets missed the playoffs that year and some argue that Fitzpatrick's play was in a week 17 loss at Buffalo was the contributing factor. With that in the recordbooks do you really have the ability to demand more tha $8 Million a season?
The questions I have been looking to answer are:
- What is the value of an NFL Player in relation to some statistic? Win/Loss ratio, QBR, TD/Interception Ratio?
- What are the salaries of the top NFL teams?
I'm sure there are many more questions that could be asked of a comprehensive NFL salary dataset:
- What are the top earning positions of a particular team and relate that to the teams performance in those categories?
- And maybe stretching the limits to making a correlation between the number of twitter mentions of a particular player and their salary.
I have found there to be shockingly little information about NFL teams and their player salaries on the internet. While Fantasy football has made player and game statistical information abundantly available the connection of the salary data and the statistics is lacking.
Getting Started
spotrac has good salary, bonus, and contract information. They claim to be:
Spotrac has become the largest online sports team, & player contract resource on the internet.
I used this site to get started with the 2017 salary of the NY Jets. It is my intention to revist this with Part 2 of this post to scrape data for all 32 teams and make a complete NFL Salary dataset.
Reading Data and Writing to a File
I leveraged the BeautifulSoup library to accomplish the webscraping and then wrote the soup object out to a file. This allowed me to just execute the next cell over and over again instead of needing to continually make calls to the website.
from urllib.request import urlopen
from bs4 import BeautifulSoup
base_url = "http://www.spotrac.com/nfl/new-york-jets/cap/"

def get_page(base_url):
    page = urlopen(base_url)
    soup = BeautifulSoup(page)
    file = open("sample_page.txt", 'w')
    file.write(str(soup))
    file.close()
Reading Data from a File
Execute the above cell once and then start here
with open("sample_page.txt", 'rb') as file:
    for line in file:
        line = line.strip()
Parse the HTML
Import the BeautifulSoup library and use the find method to get the datatable. It is important to note here, that I opened the sample_page with read binary flags "rb". Leaving off the binary was causing the parser to puke 6 ways to Sunday.
# Reimport BeautifulSoup so that I can start here
from bs4 import BeautifulSoup
page = open("sample_page.txt", 'rb')
soup = BeautifulSoup(page, "html.parser")
table = str(soup.find("table","datatable"))
Render the table
Display the HTML table - this is point of reference to understand source data
from IPython.core.display import HTML
HTML(table)
| Active Players (53) | Pos. | Base Salary | Signing Bonus | Roster Bonus | Option Bonus | Workout Bonus | Restruc. Bonus | Misc. | Dead Cap | Cap Hit | Cap % |
|---|---|---|---|---|---|---|---|---|---|---|---|
| Muhammad Wilkerson | DE | $14,750,000 | $3,000,000 | - | - | $250,000 | - | - | ($27,000,000) | $18,000,000 | 12.17 |
| Buster Skrine | CB | $6,000,000 | $1,250,000 | - | - | - | $1,250,000 | - | ($11,000,000) | $8,500,000 | 5.75 |
| Brian Winters | G | $1,000,000 | - | $7,000,000 | - | - | - | - | ($22,000,000) | $8,000,000 | 5.41 |
| James Carpenter | G | $4,450,000 | $875,000 | $250,000 | - | - | $1,230,000 | - | ($8,660,000) | $6,805,000 | 4.60 |
| Josh McCown | QB | $3,000,000 | $3,000,000 | - | - | - | - | $500,000 | ($6,000,000) | $6,500,000 | 4.39 |
| Leonard Williams | DE | $615,000 | $2,952,430 | $1,513,716 | - | - | - | - | ($11,009,149) | $5,081,146 | 3.44 |
| Matt Forte | RB | $4,000,000 | $1,000,000 | - | - | - | - | - | ($6,000,000) | $5,000,000 | 3.38 |
| Kelvin Beachum | LT | $1,500,000 | $1,500,000 | $2,000,000 | - | - | - | - | ($12,000,000) | $5,000,000 | 3.38 |
| Morris Claiborne | CB | $2,500,000 | $2,000,000 | $218,750 | - | - | - | - | ($4,500,000) | $4,718,750 | 3.19 |
| Bilal Powell | RB | $3,750,000 | $883,333 | - | - | - | - | - | ($5,516,668) | $4,633,333 | 3.13 |
| Benjamin Ijalana | RT | $2,000,000 | $1,000,000 | $1,250,000 | - | - | - | - | ($4,000,000) | $4,250,000 | 2.87 |
| Jamal Adams | S | $465,000 | $3,582,038 | - | - | - | - | - | ($14,328,154) | $4,047,038 | 2.74 |
| Steve McLendon | DT | $2,875,000 | $750,000 | $171,875 | $125,000 | - | - | - | ($4,500,000) | $3,921,875 | 2.65 |
| Wesley Johnson | C | $2,746,000 | - | - | - | - | - | - | - | $2,746,000 | 1.86 |
| Marcus Williams | CB | $2,746,000 | - | - | - | - | - | - | - | $2,746,000 | 1.86 |
| Darron Lee | ILB | $914,620 | $1,408,481 | - | - | - | - | - | ($6,519,304) | $2,323,101 | 1.57 |
| Demario Davis | ILB | $900,000 | $100,000 | - | - | - | - | $1,225,000 | ($1,000,000) | $2,225,000 | 1.50 |
| Jermaine Kearse | WR | $2,200,000 | - | - | - | - | - | - | ($2,200,000) | $2,200,000 | 1.49 |
| Josh Martin | OLB | $1,550,000 | $225,000 | - | $75,000 | - | - | - | ($2,000,000) | $1,850,000 | 1.25 |
| Marcus Maye | S | $465,000 | $726,643 | - | - | - | - | - | ($3,669,485) | $1,191,643 | 0.81 |
| Christian Hackenberg | QB | $661,832 | $397,327 | - | - | - | - | - | ($1,853,816) | $1,059,159 | 0.72 |
| Austin Seferian-Jenkins | TE | $936,690 | - | - | - | $75,000 | - | - | - | $1,011,690 | 0.68 |
| Mike Pennel | DE | $690,000 | - | $171,875 | - | $50,000 | - | - | ($50,000) | $911,875 | 0.62 |
| Chandler Catanzaro | K | $900,000 | - | - | - | - | - | - | ($900,000) | $900,000 | 0.61 |
| Jonotthan Harrison | C | $700,000 | $50,000 | $81,250 | - | - | - | - | ($50,000) | $831,250 | 0.56 |
| Kony Ealy | DE | $803,660 | - | - | - | - | - | - | - | $803,660 | 0.54 |
| Bruce Carter | ILB | $775,000 | - | - | - | - | - | - | ($775,000) | $775,000 | 0.52 |
| Jeremy Kerley | WR | $775,000 | - | - | - | - | - | - | ($775,000) | $775,000 | 0.52 |
| Julian Stanford | OLB | $775,000 | - | - | - | - | - | - | ($775,000) | $775,000 | 0.52 |
| Dakota Dozier | G | $690,000 | $75,146 | - | - | - | - | - | ($75,146) | $765,146 | 0.52 |
| Bryce Petty | QB | $615,000 | $138,424 | - | - | - | - | - | ($276,848) | $753,424 | 0.51 |
| Jordan Jenkins | OLB | $560,000 | $180,980 | - | - | - | - | - | ($542,940) | $740,980 | 0.50 |
| Terrence Brooks | FS | $705,000 | - | - | - | - | - | - | - | $705,000 | 0.48 |
| David Bass | DE | $683,824 | - | - | - | - | - | - | - | $683,823 | 0.46 |
| Juston Burris | CB | $540,000 | $137,782 | - | - | - | - | - | ($413,349) | $677,782 | 0.46 |
| ArDarius Stewart | WR | $465,000 | $211,581 | - | - | - | - | - | ($846,324) | $676,581 | 0.46 |
| Rontez Miles | FS | $615,000 | - | - | - | - | - | - | - | $615,000 | 0.42 |
| Brent Qvale | RT | $615,000 | - | - | - | - | - | - | - | $615,000 | 0.42 |
| Darryl Roberts | CB | $615,000 | - | - | - | - | - | - | - | $615,000 | 0.42 |
| Neal Sterling | TE | $615,000 | - | - | - | - | - | - | - | $615,000 | 0.42 |
| Will Tye | TE | $615,000 | - | - | - | - | - | - | - | $615,000 | 0.42 |
| Brandon Shell | T | $540,000 | $58,991 | - | - | - | - | - | ($176,975) | $598,991 | 0.41 |
| Chad Hansen | WR | $465,000 | $104,912 | - | - | - | - | - | ($419,648) | $569,912 | 0.39 |
| Lac Edwards | P | $540,000 | $18,948 | - | - | - | - | - | ($56,847) | $558,948 | 0.38 |
| Charone Peake | WR | $540,000 | $17,095 | - | - | - | - | - | ($51,287) | $557,095 | 0.38 |
| Robby Anderson | WR | $540,000 | $3,333 | - | - | - | - | - | ($6,667) | $543,333 | 0.37 |
| Eric Tomlinson | TE | $540,000 | - | - | - | - | - | - | - | $540,000 | 0.37 |
| Jordan Leggett | TE | $465,000 | $70,511 | - | - | - | - | - | ($282,045) | $535,511 | 0.36 |
| Dylan Donahue | OLB | $465,000 | $50,484 | - | - | - | - | - | ($201,937) | $515,484 | 0.35 |
| Elijah McGuire | RB | $465,000 | $42,126 | - | - | - | - | - | ($168,505) | $507,126 | 0.34 |
| Derrick Jones | CB | $465,000 | $36,261 | - | - | - | - | - | ($145,047) | $501,261 | 0.34 |
| Thomas Hennessy | LS | $465,000 | - | - | - | - | - | - | - | $465,000 | 0.31 |
| Lawrence Thomas | DE | $437,647 | - | - | - | - | - | - | - | $437,647 | 0.30 |
Table Rows
rows = [row for row in soup.find("table", "datatable").find_all("tr")]
players = []
for row in rows:
    if row.get_text("tr") is not None:
        players.append(row)

len(players)
54
Column Headers
Get the 12 column headers and put them into a list using list compression - this will be used later to rename the column headers in the dataframe
columns_headers = [col.get_text() for col in players[0].find_all("th") if col.get_text()]
columns_headers
['Active Players  (53)',
 'Pos.',
 'Base Salary',
 'Signing Bonus',
 'Roster Bonus',
 'Option Bonus',
 'Workout Bonus',
 'Restruc. Bonus',
 'Misc.',
 'Dead Cap',
 'Cap Hit',
 'Cap %']
List of player names
Get the player names from the td tags that are of class="player"
I sliced this to get only the first 110 records because the rest have the same labels as above. This should be a list of 53 to reflect the 53 man roster. Some records are last name only like "Wilkerson" and then "Muhammad Wilkerson" so there are duplicates.
td_tags = soup.find_all("td", {"class":"player"})[:110]
player_names = []

for row in td_tags:
    player_names.append(row.get_text())


final_player_names = []
for names in player_names:
        names = names.strip().split("\n")
        if len(names[1:]) > 0:
            final_player_names.append(names[1:])

#slice the list to show only the top 10 names
final_player_names[:10]
[['Muhammad Wilkerson'],
 ['Buster Skrine'],
 ['Brian Winters'],
 ['James Carpenter'],
 ['Josh McCown'],
 ['Leonard Williams'],
 ['Matt Forte'],
 ['Kelvin Beachum'],
 ['Morris Claiborne'],
 ['Bilal Powell']]
Get ALL the data
This pattern gets all the TD cells from ALL the rows. Earlier, I was using a pattern to extract one column at a time and then smash them all back together, but this is way more effecient.
player_data = [[td.getText() for td in rows[i].findAll('td')]
            for i in range(len(rows))]

#Slice the list to show only the 1st record
player_data[1]
['Wilkerson\nMuhammad Wilkerson ',
 'DE',
 '$14,750,000',
 '$3,000,000',
 '-',
 '-',
 '$250,000',
 '-',
 '-',
 '($27,000,000)',
 '$18,000,000 ',
 '12.17']
import pandas as pd
df2 = pd.DataFrame(player_data, columns=None)
df2 = df2.drop(df2.index[[0]])
df2[0] = final_player_names
Clean the Data
Now that we have all the data we need to clean it before it will be in it's final usable format
#Update the column headers
df2.columns = [columns_headers]
df2.head()
| Active Players (53) | Pos. | Base Salary | Signing Bonus | Roster Bonus | Option Bonus | Workout Bonus | Restruc. Bonus | Misc. | Dead Cap | Cap Hit | Cap % | |
|---|---|---|---|---|---|---|---|---|---|---|---|---|
| 1 | [Muhammad Wilkerson] | DE | $14,750,000 | $3,000,000 | - | - | $250,000 | - | - | ($27,000,000) | $18,000,000 | 12.17 |
| 2 | [Buster Skrine] | CB | $6,000,000 | $1,250,000 | - | - | - | $1,250,000 | - | ($11,000,000) | $8,500,000 | 5.75 |
| 3 | [Brian Winters] | G | $1,000,000 | - | $7,000,000 | - | - | - | - | ($22,000,000) | $8,000,000 | 5.41 |
| 4 | [James Carpenter] | G | $4,450,000 | $875,000 | $250,000 | - | - | $1,230,000 | - | ($8,660,000) | $6,805,000 | 4.60 |
| 5 | [Josh McCown] | QB | $3,000,000 | $3,000,000 | - | - | - | - | $500,000 | ($6,000,000) | $6,500,000 | 4.39 |
#Use a regex to turn the Cap Hit column into a foat so that we can do math on it
df2['Cap Hit'] = (df2['Cap Hit'].replace( '[\$,)]','', regex=True ).replace( '[(]','-', regex=True ).astype(float))
#Sanity check to make sure the above worked
df2['Cap Hit'].sum()
121989564.0
Mo Wilkerson makes $1.25M Per Game
Assuming 16 games in a season and he makes all of his bonuses.
df2['Player Salary Per Game'] = df2['Cap Hit']/16
df2.head()
| Active Players (53) | Pos. | Base Salary | Signing Bonus | Roster Bonus | Option Bonus | Workout Bonus | Restruc. Bonus | Misc. | Dead Cap | Cap Hit | Cap % | Player Salary Per Game | |
|---|---|---|---|---|---|---|---|---|---|---|---|---|---|
| 1 | [Muhammad Wilkerson] | DE | $14,750,000 | $3,000,000 | - | - | $250,000 | - | - | ($27,000,000) | 18000000.0 | 12.17 | 1125000.0 |
| 2 | [Buster Skrine] | CB | $6,000,000 | $1,250,000 | - | - | - | $1,250,000 | - | ($11,000,000) | 8500000.0 | 5.75 | 531250.0 |
| 3 | [Brian Winters] | G | $1,000,000 | - | $7,000,000 | - | - | - | - | ($22,000,000) | 8000000.0 | 5.41 | 500000.0 |
| 4 | [James Carpenter] | G | $4,450,000 | $875,000 | $250,000 | - | - | $1,230,000 | - | ($8,660,000) | 6805000.0 | 4.60 | 425312.5 |
| 5 | [Josh McCown] | QB | $3,000,000 | $3,000,000 | - | - | - | - | $500,000 | ($6,000,000) | 6500000.0 | 4.39 | 406250.0 |
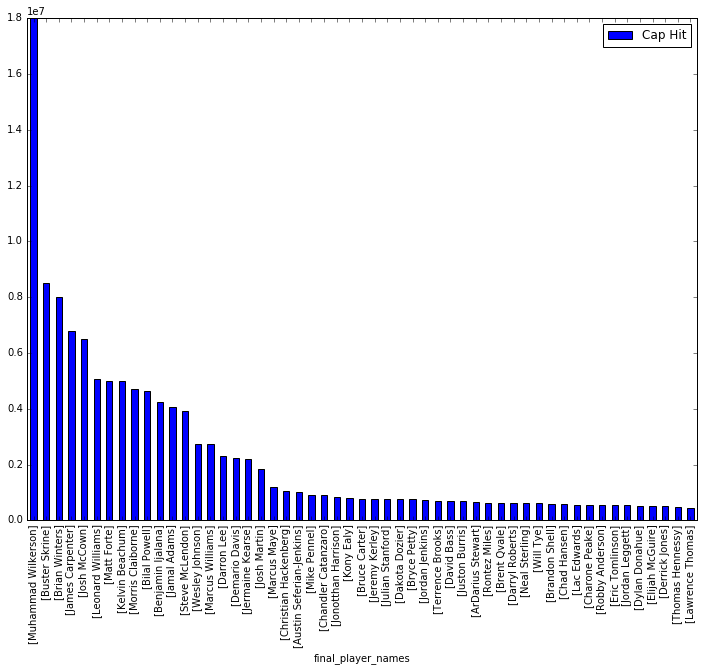
#Plot the salaries for each player in a barchart
#Created a new dataframe with only those columns needed - this may not have been necessary
barchart_columns = ['Active Players  (53)', 'Cap Hit']
df_for_chart = df2[barchart_columns]
#Reindex the datafram so that the labels on the chart would show up
df_for_chart = df_for_chart.set_index(df2['Active Players  (53)'])
barchart = df_for_chart.plot(kind='bar', figsize=(12, 9))
barchart.set_xlabel("final_player_names")
<matplotlib.text.Text at 0x117fef208>
#Display the chart
import matplotlib.pyplot as plt
plt.show()
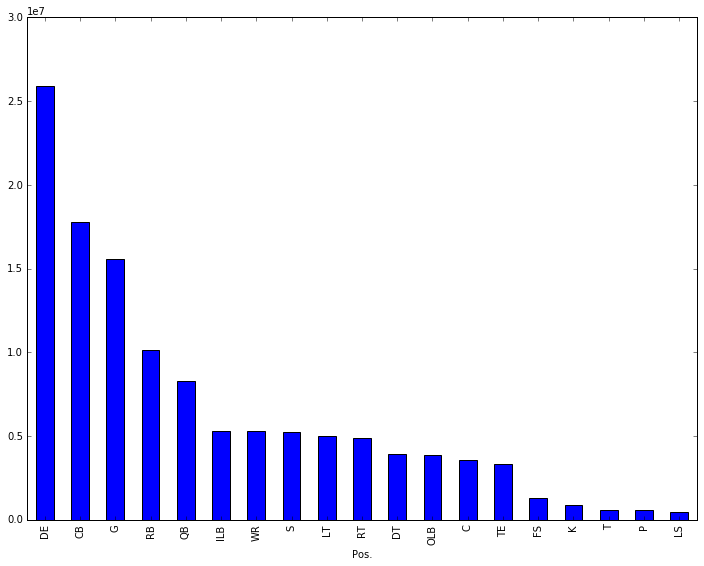
Average Salary By Position
Thought it would be interesting to group the players by position and see the spend by position. Perhaps I'll create another higher level grouping by creating a new variable and taging all of the defensive positions as 'DEF' and all the offensive positions as 'OFF' and then group them that way. With that I'll see how the team ranks overall as on defense as compared to their spend.
grouped_data = df2.groupby(df2['Pos.']).sum()
grouped_data = grouped_data.sort_values(by='Cap Hit', ascending = False)
barchart_by_position = grouped_data['Cap Hit'].plot(kind='bar', figsize=(12, 9))
plt.show()